in Platform Updates

How Our Churn Has Changed Over the Years

Jacob Firuta in Charts, on September 28, 2017

How our churn has changed over the years

The chart below shows how customer churn looks like in LiveChat for specific months for the past 2+ years:

LiveChat churn over the last 2 years

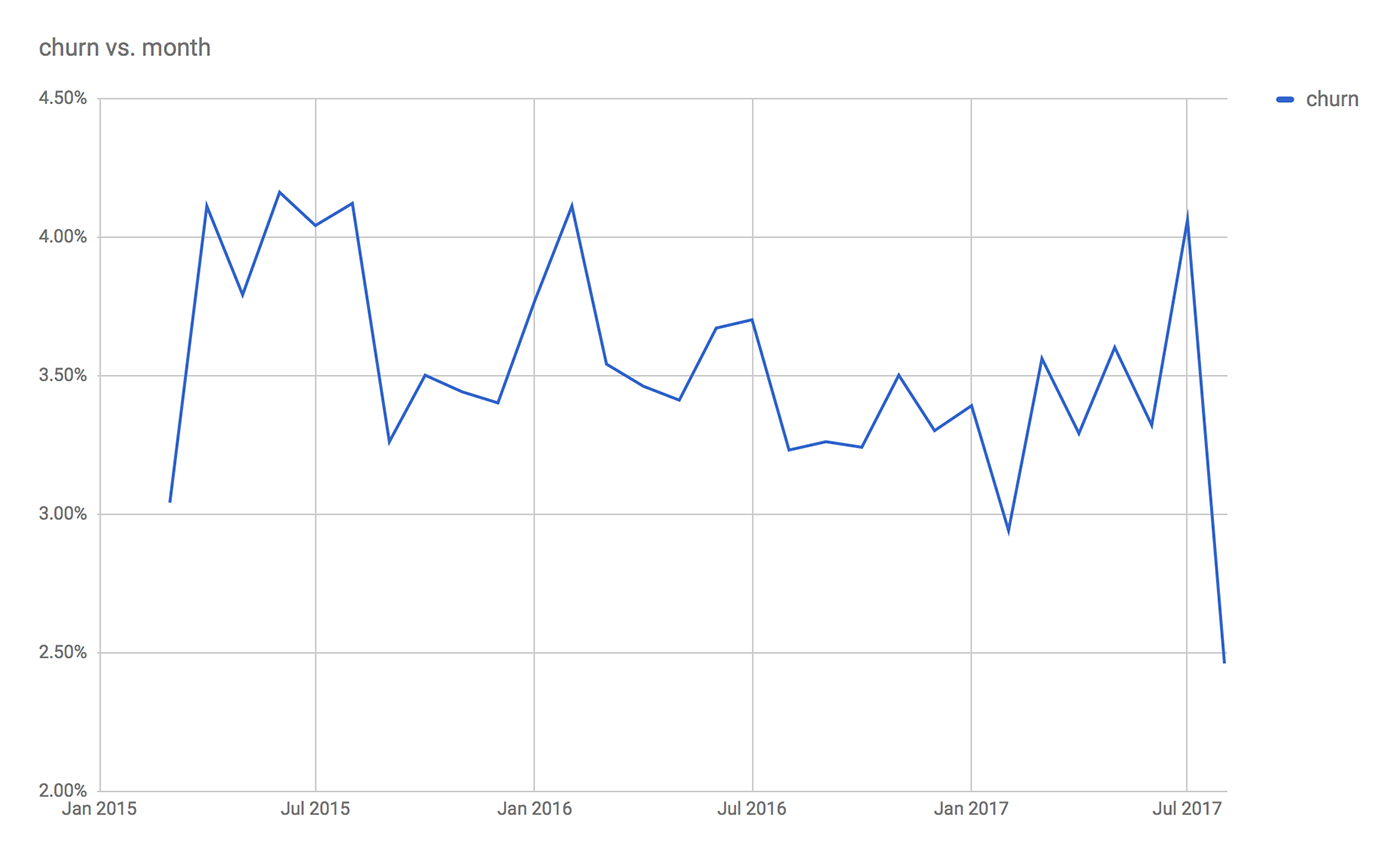
Chart #1: LiveChat customer churn over time.

Here’s the same data year-over-year:

LiveChat churn year-over-year

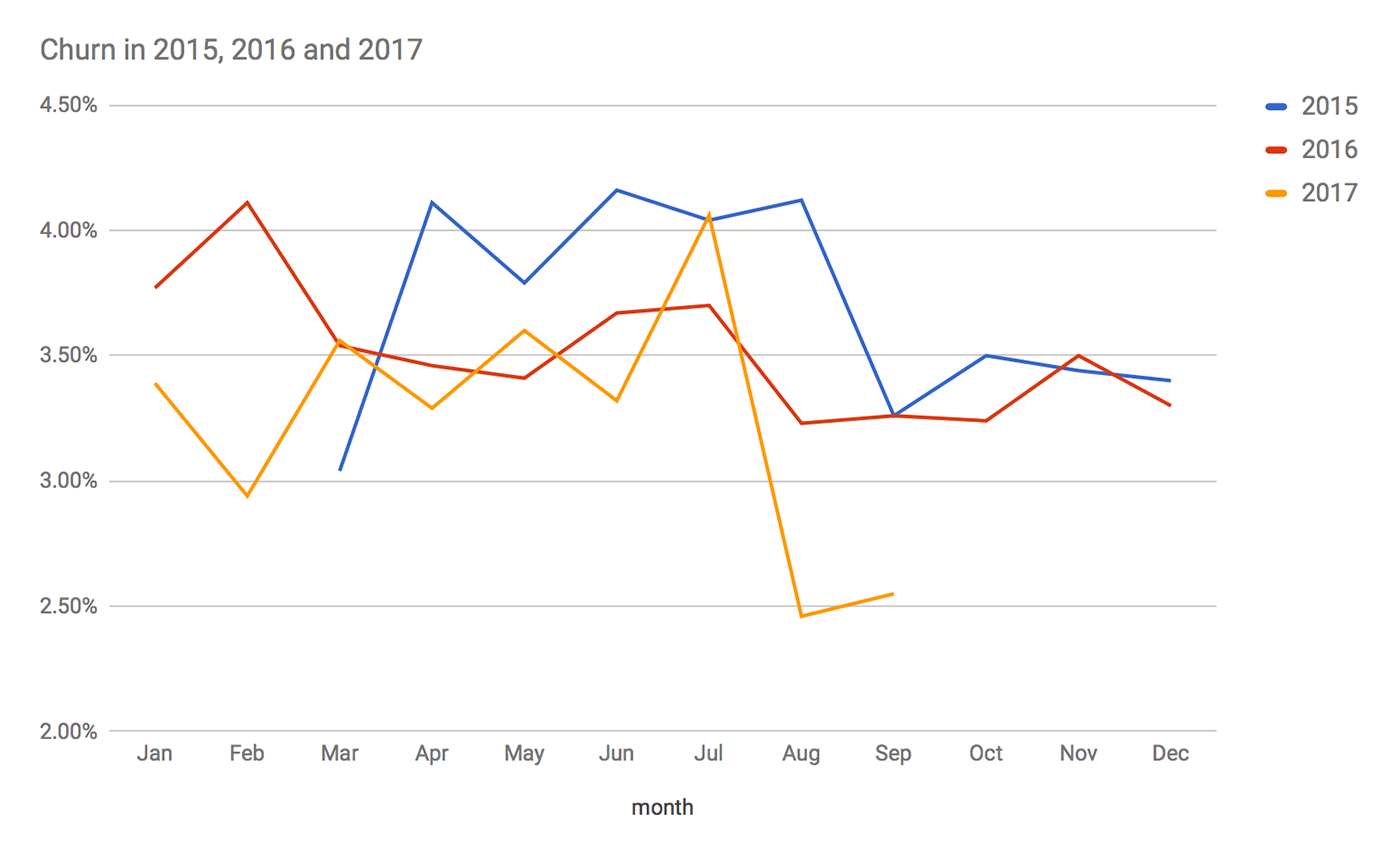
Chart #2: LiveChat customer churn year-over-year.

The data represents our four main pricing plans: Starter, Regular, Team and Enterprise (we didn’t have enough data about the Enterprise+ plan). As you can see, a recent addition to our cancellation form helped us reduce the number of churning customers considerably.

See other Platform Updates

Turkish Gambling Peak

Turkish Gambling Peak Some time ago we discovered a significant jump in the number of chats among our trial customers (around 300% more….

Read more

Four Million Chats Weekly

Four Million Chats Weekly Recently we hit a big milestone: all LiveChat licenses have generated over four million chats weekly.

Read more
See all updates